There’s a lot of way to make some graph in PHP. The simplest way is use table format and tag <td>, we can make graph from the property width. Here is the example :
$id_sql = “SELECT DISTINCT substring(waktu,9,2),count(idLog) FROM waktutime WHERE waktu LIKE ‘”.$tahun.”-“.$bulan.”%’ GROUP BY waktu”; $result = mysql_query($id_sql);
echo “<center><font size=2px color=orange>GRAFIK HARIAN BULAN “.$bulan.”</font></center><br/><br/>”;
echo “<table width=170 cellspacing=0 cellpadding=0 border=1 align=center bgcolor=>”;
while ($arrData = $db1->_FArray()) {
if (!empty($arrData[0])) {
$x = $arrData[1];
echo “<tr><td width=100% background-color=#E0F0FF>$arrData[0] : <img
src=images/01.gif width=$x height=10> $arrData[1] <br><span
class=trebuchet></span></td></tr>”;
}
}
And we now have some simple graph in PHP. But we also make some graph using jpgraph. You can download the newest version here http://www.aditus.nu/jpgraph/jpdownload.php but we have to use PHP 5.1.0 version. There’s a lot kind of graph we can make, now I just explain to you how to make graph use data from the table.
This is an example by using jpgraph :
include (“graph/jpgraph.php”);
include (“graph/jpgraph_bar.php”);
// We need some data
mysql_connect(“localhost”, “root”, “”);
mysql_select_db (“none”);
$id_sql = “SELECT DISTINCT substring(NOW(),6,2) as ‘bulan’, substring(NOW(),1,4) as ‘tahun’ FROM waktu”;
$res = mysql_query($id_sql);
$ars = mysql_fetch_array($res);
$id_sql = “SELECT DISTINCT substring(waktu,9,2),count(idLog) FROM waktu WHERE waktu LIKE ‘”.$ars[tahun].”-“.$ars[bulan].”%’GROUP BY waktu”;
$result = mysql_query($id_sql);
while ($row=mysql_fetch_array($result)) {
$datax[] = $row[0];
$datay[] = $row[1];
}
// Setup the graph.
$graph = new Graph(600,400,”bargradex1″);
$graph->SetScale(“textlin”);
$graph->SetMarginColor(“silver”);
$graph->SetShadow();
// Set up the title for the graph
$graph->title->Set(“Grafik”);
$graph->title->SetFont(FF_COMIC,FS_NORMAL,18);
$graph->title->SetColor(“darkred”);
// Setup font for axis
$graph->xaxis->SetFont(FF_VERDANA,FS_NORMAL,12);
$graph->yaxis->SetFont(FF_VERDANA,FS_NORMAL,11);
// Show 0 label on Y-axis (default is not to show)
$graph->yscale->ticks->SupressZeroLabel(false);
// Setup X-axis labels
$graph->xaxis->SetTickLabels($datax);
$graph->xaxis->SetLabelAngle(0);
// Create the bar pot
$bplot = new BarPlot($datay);
$bplot->SetWidth(0.6);
// Setup color for gradient fill style
$bplot->SetFillGradient(“navy”,”lightsteelblue”,GRAD_MIDVER);
// Set color for the frame of each bar
$bplot->SetColor(“navy”);
$graph->Add($bplot);
// Finally send the graph to the browser
$graph->img->SetExpired(false);
$graph->Stroke();
?>
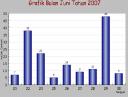
And we just running this script in our apache,, and what’s look like??

gue masih blum ngerti. ngambil data dari database mana? apakah dari database wordpress? atau buat baru?
wah,,kalo itu jelas bikin db sendiri mas 😀 Tutorial ini saya buat kl kita ingin pake data dari tabel yang telah kita buat,,hehehe…
semoga membantu,,
kalo data poin nya dimasukan dalam satu variabel array tapi kita ingin barplot nya punya 2 fillcolor dengan kondisi jika nilai data point dibawah 0 akan berwarna merah, jika diatas 0 berwarna biru.. Gima ya.. caranya???………Please ada yg tau gak…
Kalo grafiknya gukan grafik batang,spt grafik garis putus2 gitu yang entar di top nya ditarik garis antara satu koordinat ke koordinat lain gimana ya???